
Context
Why Central Europe reads differently on a meter.
Building age, climate swing, and how electricity is billed here all change what circuit-level data and thermal imaging can tell you. Generic European benchmarks rarely fit a specific building well.
A building stock shaped by decades, not seasons
Small commercial buildings around Prague and Central Bohemia span a wide range of construction periods, from pre-war structures through socialist-era industrial conversions to buildings finished in the last decade. Insulation retrofits, where they happened at all, were often partial: a roof redone in one decade, windows replaced in another, walls left untouched. The result is an envelope with an uneven thermal profile that a single average U-value figure cannot describe. Thermal imaging captures that unevenness directly, section by section, rather than assuming a uniform standard across the whole facade.

How electricity billing works here
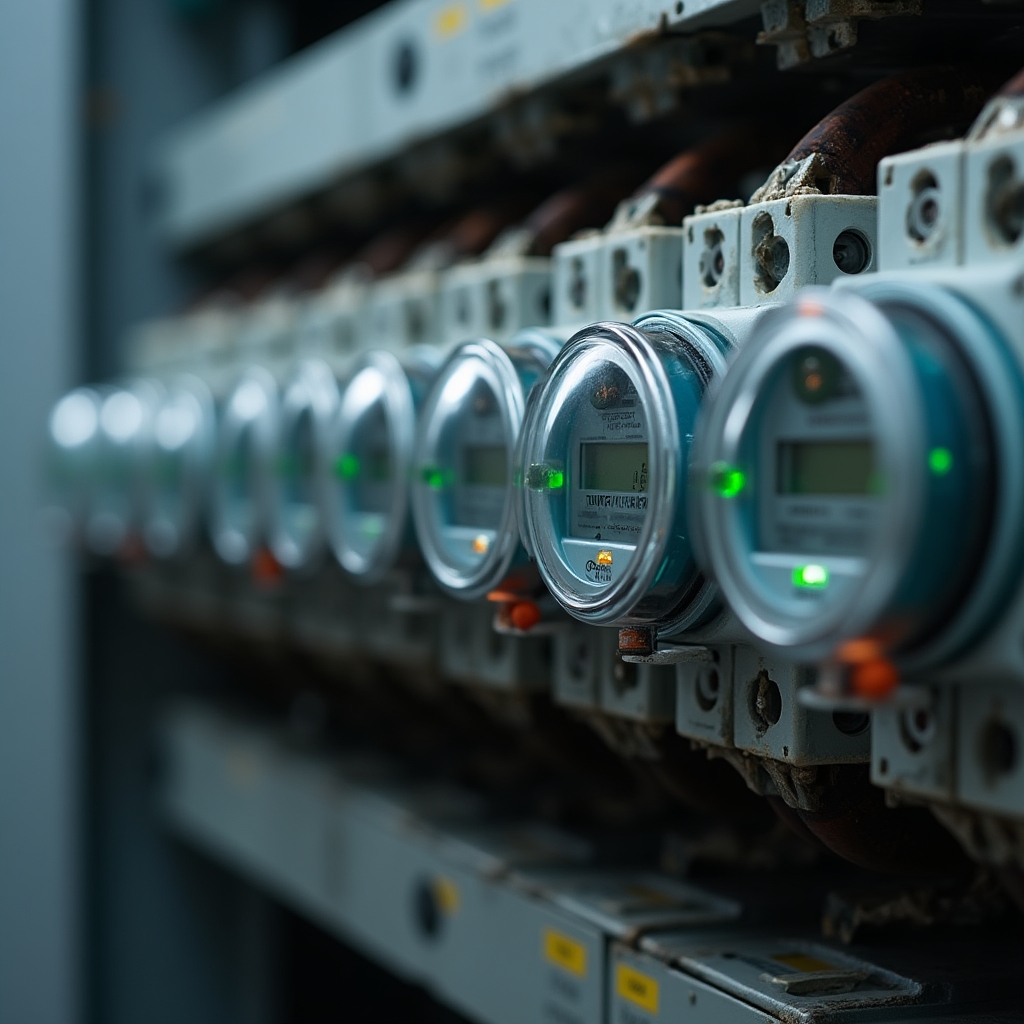
A Czech electricity bill is split between a supply component, priced per kilowatt-hour and sometimes divided into low and high tariff bands, and a distribution component tied partly to reserved capacity, the maximum draw a connection is sized for. A building that occasionally spikes above its typical load can pay for that headroom every month, whether or not it's used. Circuit-level metering shows exactly which loads cause those spikes, which a single monthly total from the supplier never reveals.
Climate: cold winters, warm summer spikes
Central Europe's continental climate produces long heating seasons and increasingly frequent warm spells in summer. For a small office or retail unit, that means two different loads matter at different times of year: heating and envelope losses in winter, and cooling or ventilation load in summer. A thermal imaging survey is most informative when there's a meaningful temperature difference between inside and outside, which is why timing the survey to the season is part of the planning conversation before any camera comes out.
Three-phase supply and per-circuit visibility
Most small commercial buildings in the region run a three-phase supply into a distribution board with a dozen or more circuit breakers. A smart meter installed by the distributor only reads the total draw at the connection point. Fitting non-invasive current sensors inside the existing board, on the circuits themselves, is what turns one number into a breakdown by function: lighting on one phase, refrigeration on another, an idle server rack running unnoticed on a third. That level of detail is standard practice in our engagements, not an upgrade option.
Why generic benchmarks don't fit every building
Published energy benchmarks for commercial floor space describe averages across many buildings and are useful as a rough starting point, nothing more. A workshop with a compressor running through the night behaves nothing like a retail unit with daytime-only lighting, even if both are labelled "small commercial" in a benchmark table. Measuring the specific building, at the circuit level and with an infrared camera, replaces an assumption with a fact about that building alone.